
Databricks Logs Explained: Where to Look When Things Break From Driver to Delta
Author: Aishwarya Manoharan
20 May, 2026
Introduction
A Databricks job fails… or worse, it runs but performs poorly.
You open the workspace and face a familiar question:
Where do you start?
Driver logs? Spark UI? Executor logs? Query history?
Without a clear approach, it’s easy to jump between tabs and waste time chasing symptoms instead of root causes.
This guide provides a structured, layer-by-layer approach to Databricks logs, so you know exactly where to look, what each log tells you, and how it connects to real debugging scenarios and certification concepts.
It walks through each log type with:
- What to look for
- What it tells us
- Exactly where to find it in the Databricks UI
The Mental Model: Debugging Top-Down
Before diving into individual logs, anchor yourself in this hierarchy:
Cluster → Driver → Executor → Stage → Task → Table (Delta)
- Cluster: Infrastructure and lifecycle events
- Driver: Job orchestration and failures
- Executor: Parallel task execution and resource issues
- Stage: Shuffle boundaries and data distribution
- Task: Fine-grained execution and skew
- Table (Delta): Data operations and history
Rule of Thumb
- Debug top-down (start broad, narrow down)
- Optimize bottom-up (fix root causes at task level)
Core Log Types with Deep Interpretation
1. Cluster Event Logs
Scope: Cluster lifecycle
Where to find (UI path): Compute → Cluster → Event Log tab
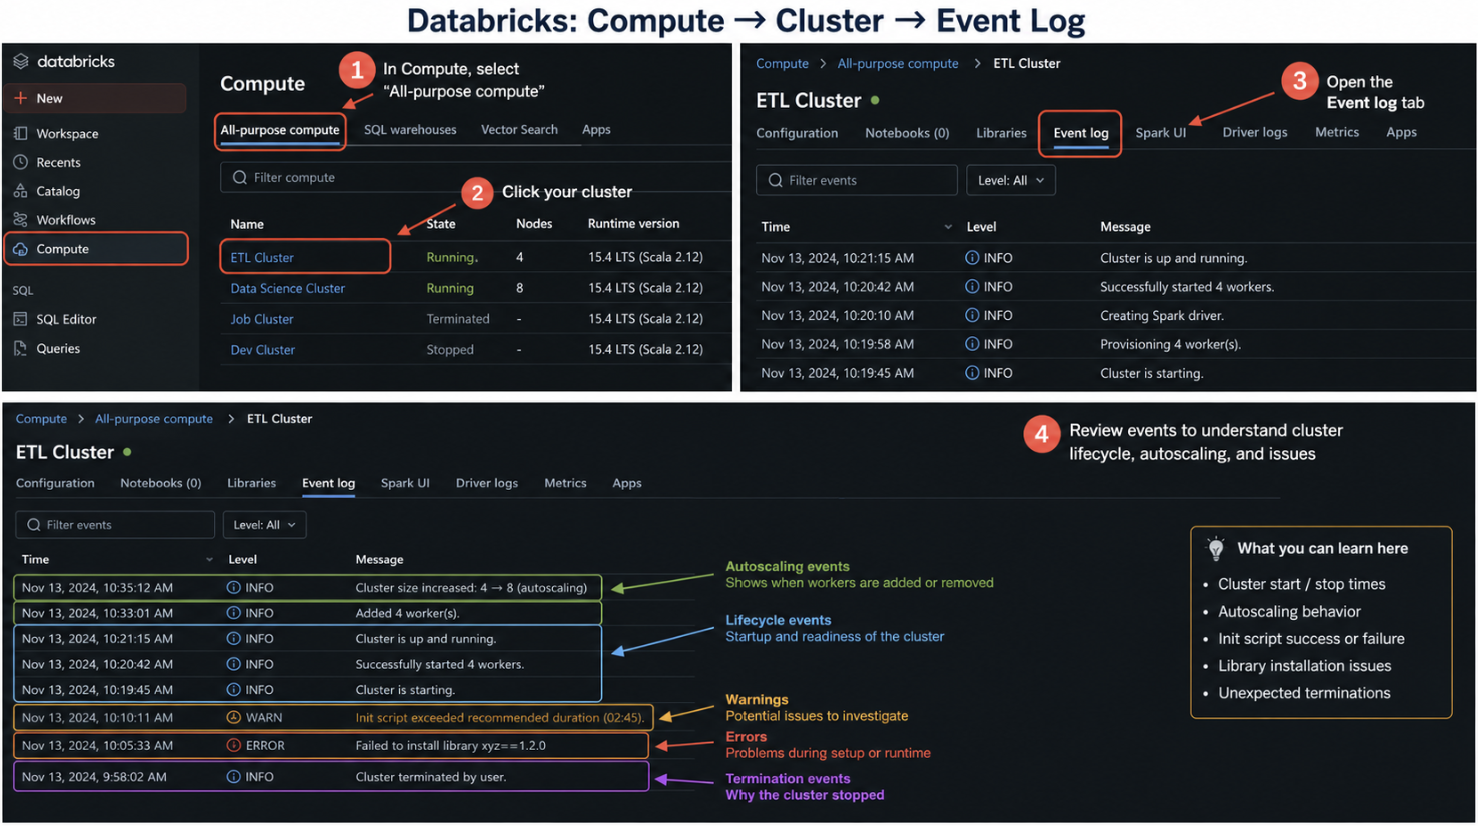
What we see in the logs and how to interpret it
Cluster start / terminate events
- Cluster starting → resources being provisioned
- Cluster terminated → job finished OR failure OR idle timeout
- Unexpected termination → check policies, spot/preemptible loss, or failures
Autoscaling actions (scale up / down)
- Scaling up (adding workers) → workload requires more parallelism
- Scaling down (removing workers) → cluster is underutilized
- Frequent scale up/down → unstable workload or poor partitioning
- No scale up despite load → autoscaling limits or misconfiguration
Init script execution
- Success → environment correctly configured
- Failure → dependency/setup issue (libraries, mounts, configs)
- Long execution time → slowing cluster startup
Errors during cluster setup
- Library install failure → dependency mismatch
- Node allocation failure → cloud capacity or quota issue
- Permission errors → IAM / role misconfiguration
2. Driver Logs
Scope: Job orchestration
Where to find (UI path): Compute → Cluster → Driver Logs
OR
Workflows → Job → Run → Driver Logs
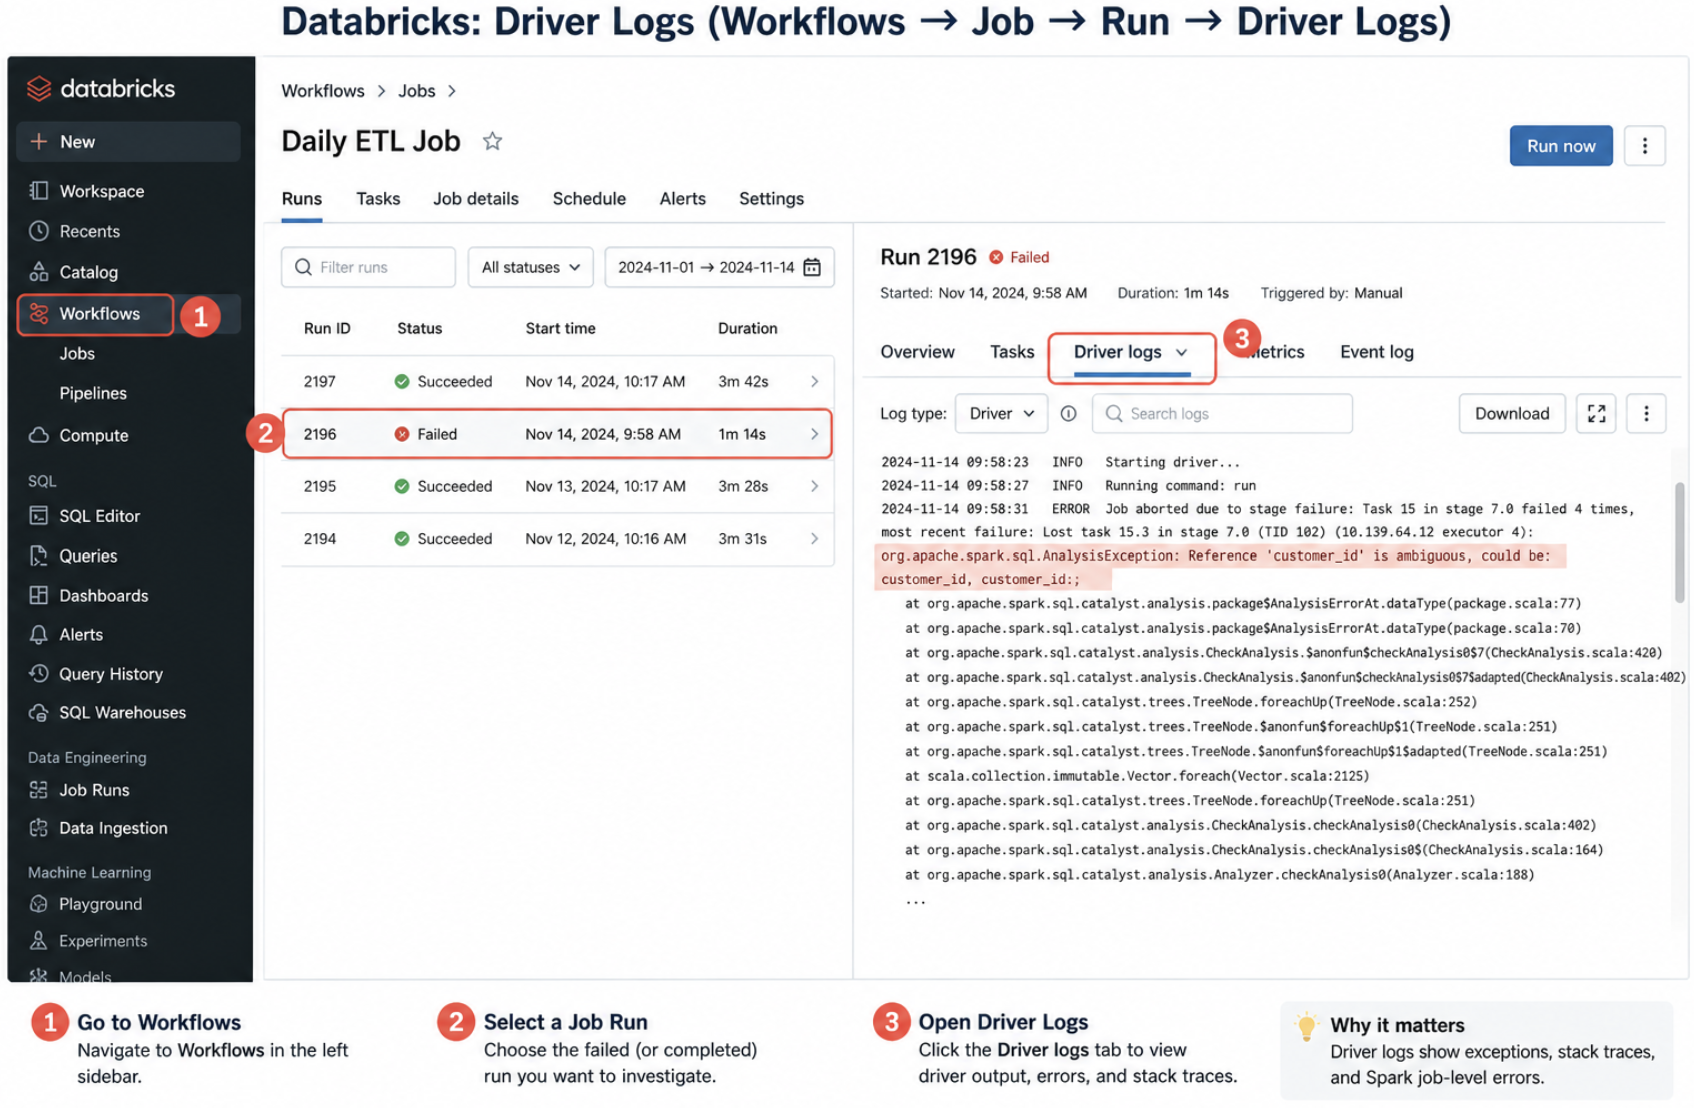
What we see in the logs and how to interpret it
SparkContext initialization
- Successful init → cluster ready for execution
- Failure → configuration issue or incompatible settings
Query planning and execution coordination
- Logical/physical plan generation → Spark deciding execution strategy
- Long planning time → complex query or large schema
Exceptions and stack traces
- NullPointer / AnalysisException → code or schema issue
- Job aborted → failure in execution stage
- Repeated failures → systemic issue, not transient
Broadcast join behavior
- Broadcast created → small table optimized for join
- Broadcast too large → failure or fallback to shuffle join
Driver OutOfMemory (OOM)
- Large collect() or toPandas() → data pulled to driver
- Large broadcast → exceeds driver memory
3. Executor Logs
Scope: Worker nodes
Where to find (UI path): Compute → Cluster → Executors → stdout / stderr
OR
Spark UI → Executors → Logs
What we see in the logs and how to interpret it
Task execution logs
- Normal execution → tasks distributed properly
- Repeated retries → instability or skew
Memory usage and GC (Garbage Collection)
- Frequent GC → memory pressure
- Long GC pauses → inefficient memory allocation
Spill to disk (very important)
- Spill occurs → memory insufficient for operation
- Heavy spill → performance degradation
- No spill → workload fits in memory
Shuffle operations
- Shuffle read/write → data redistribution across nodes
- Large shuffle → expensive joins/aggregations
Executor failures
- Executor lost → node crash or resource exhaustion
- Fetch failures → shuffle data unavailable
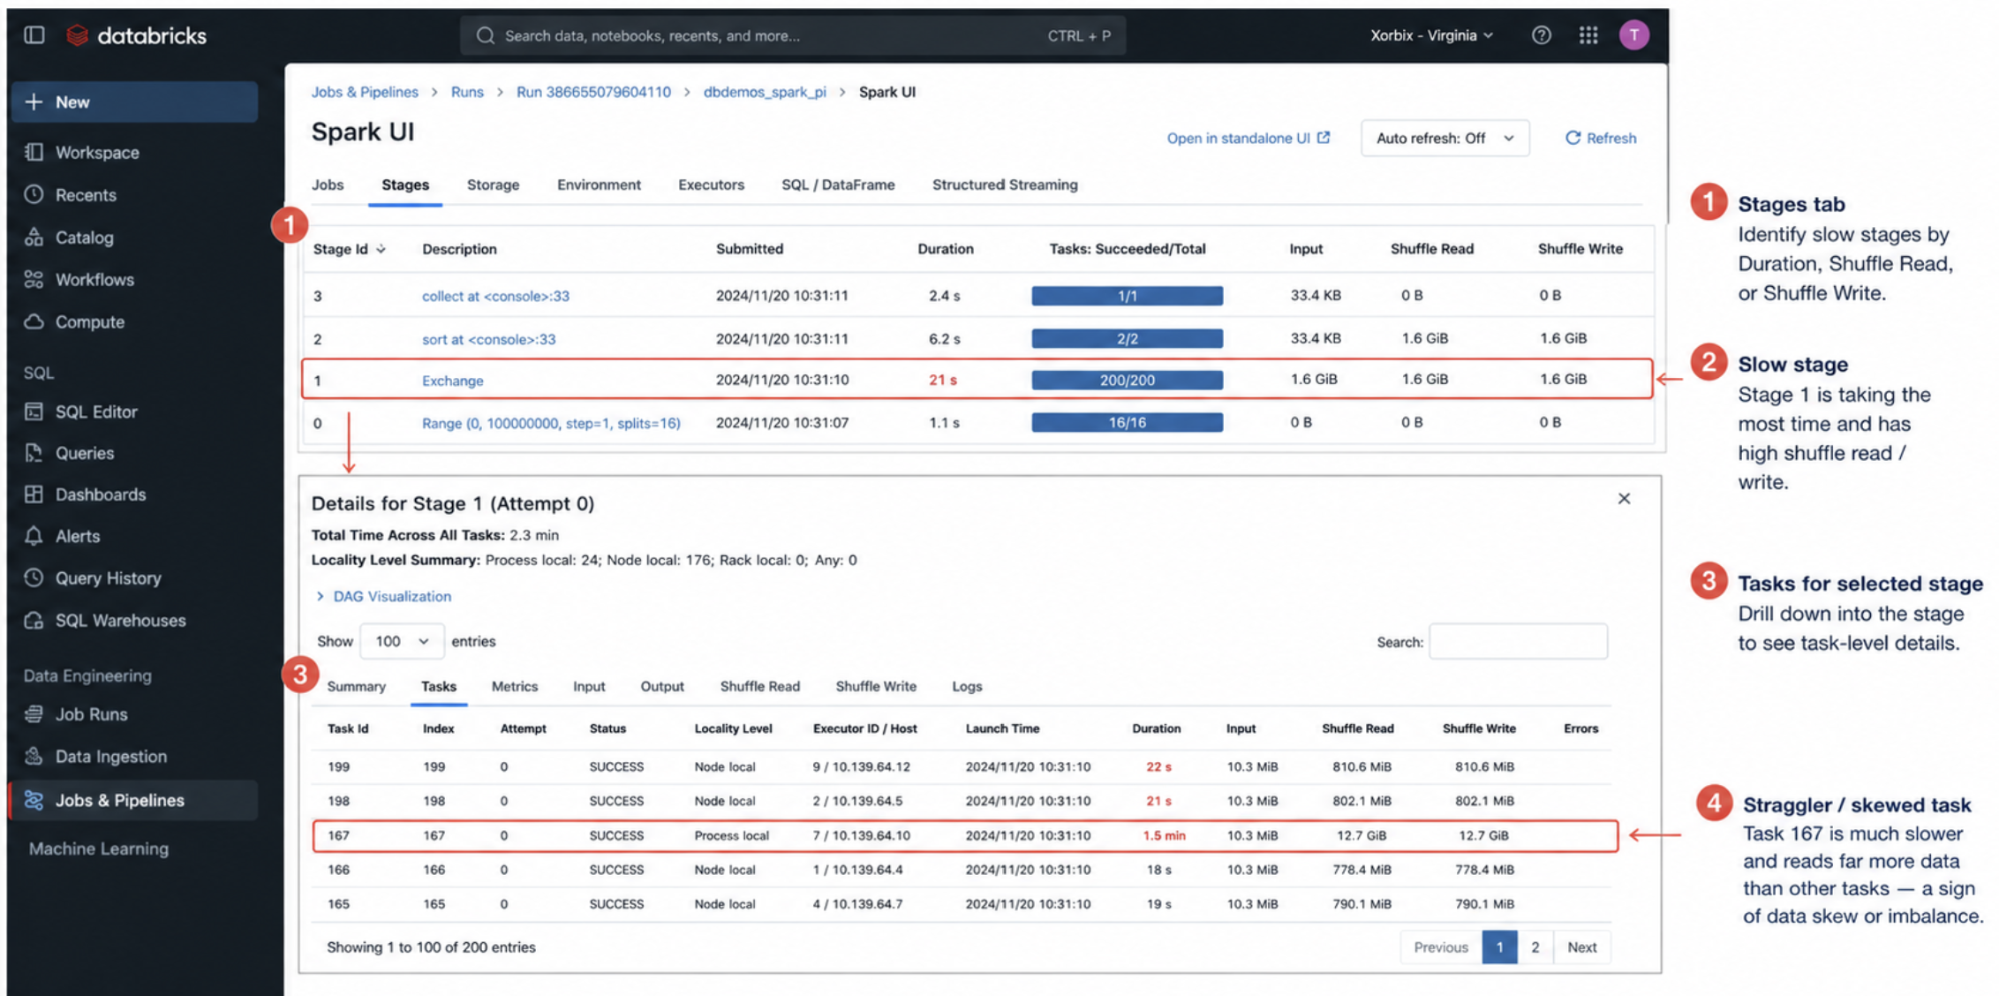
4. Stage Logs (Spark UI)
Scope: Stage-level execution
Where to find (UI path): Workflows → Job → Run → Spark UI → Stages tab
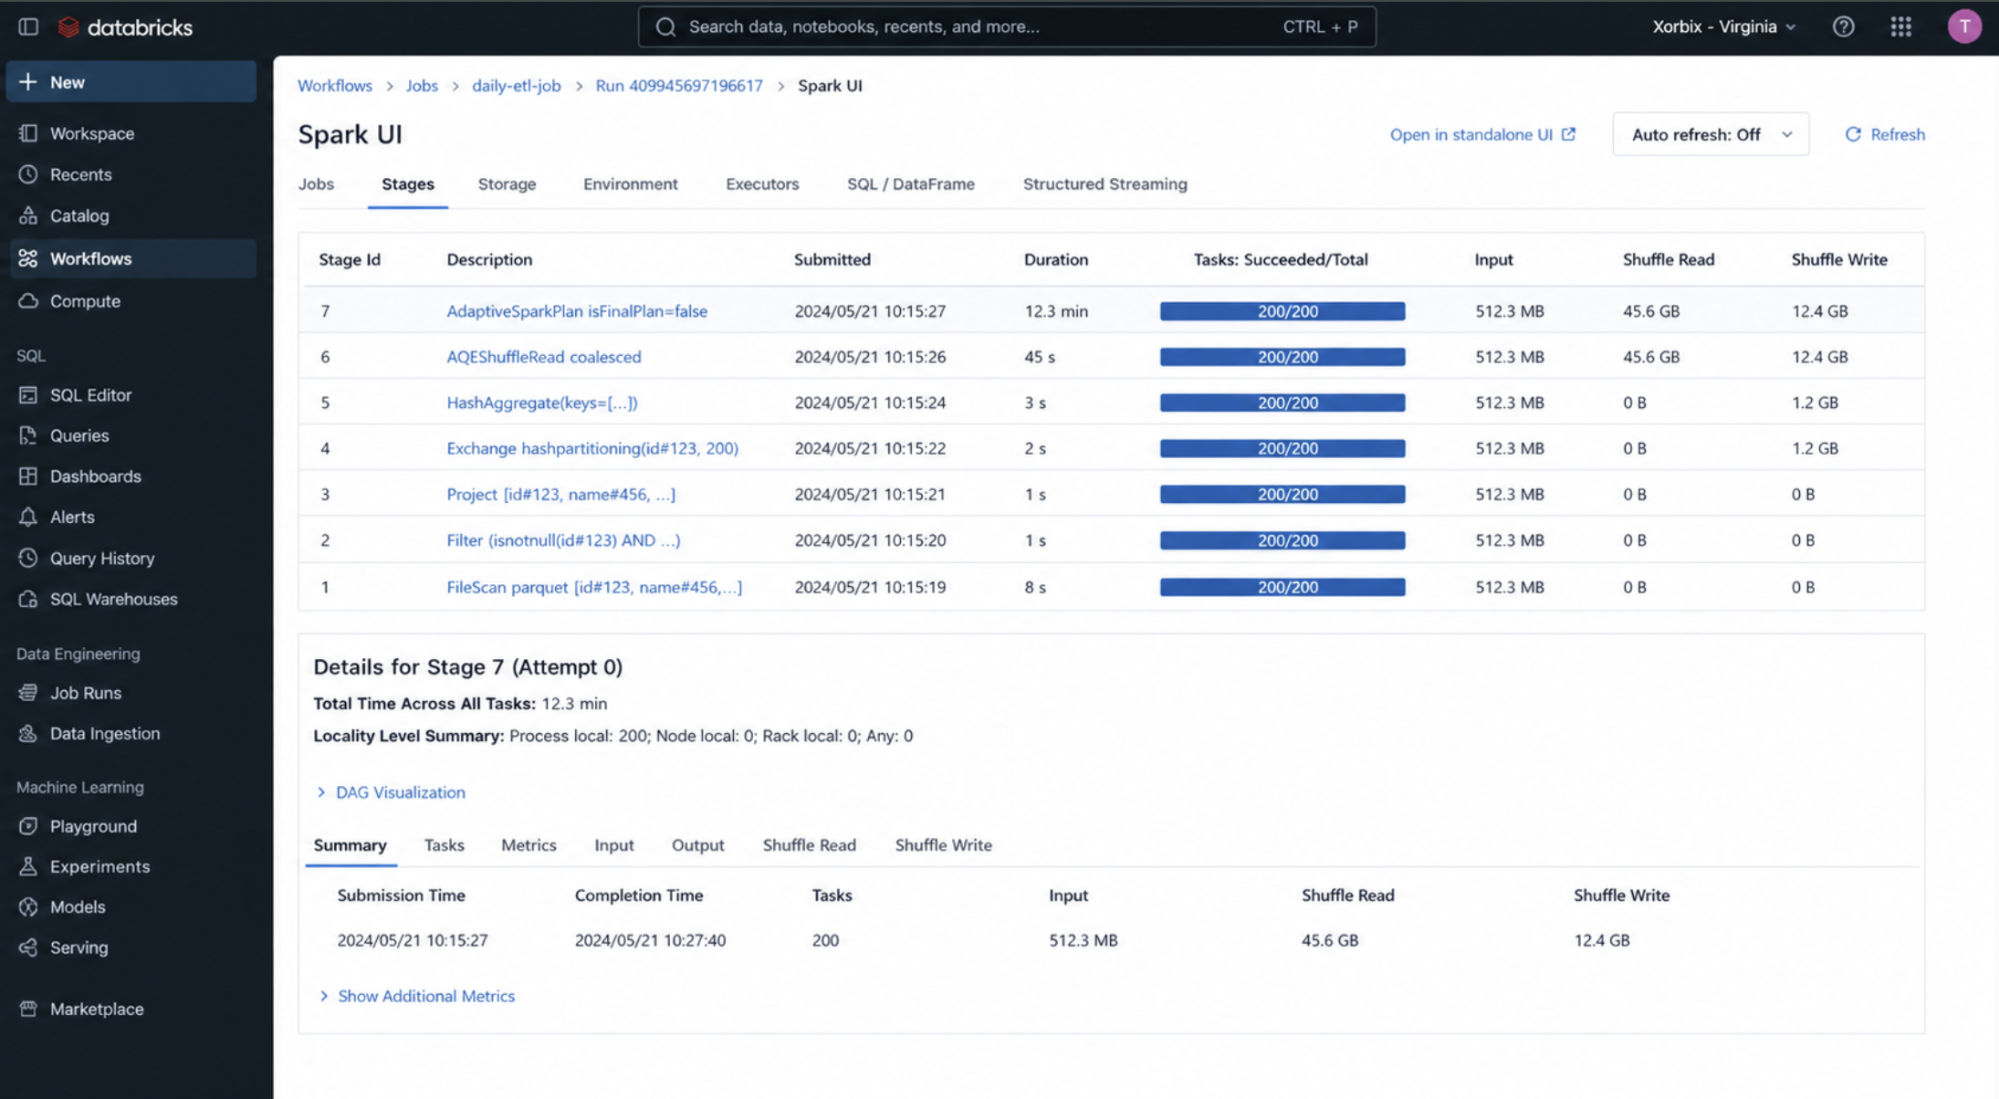
What we see in the logs and how to interpret it
Shuffle read size
- Large read → heavy dependency on previous stage
- Skewed read → uneven data distribution
Shuffle write size
- Large write → expensive transformation (join/groupBy)
- Small write → efficient stage
Stage duration
- Long duration → bottleneck stage
- Short duration → efficient processing
Task distribution within stage
- Even distribution → balanced workload
- Uneven distribution → data skew
Stage retries
- Retry occurred → transient failure or instability
- Multiple retries → deeper issue (data or infra)
5. Task Logs
Scope: Individual tasks
Where to find (UI path): Spark UI → Stages → Select Stage → Tasks
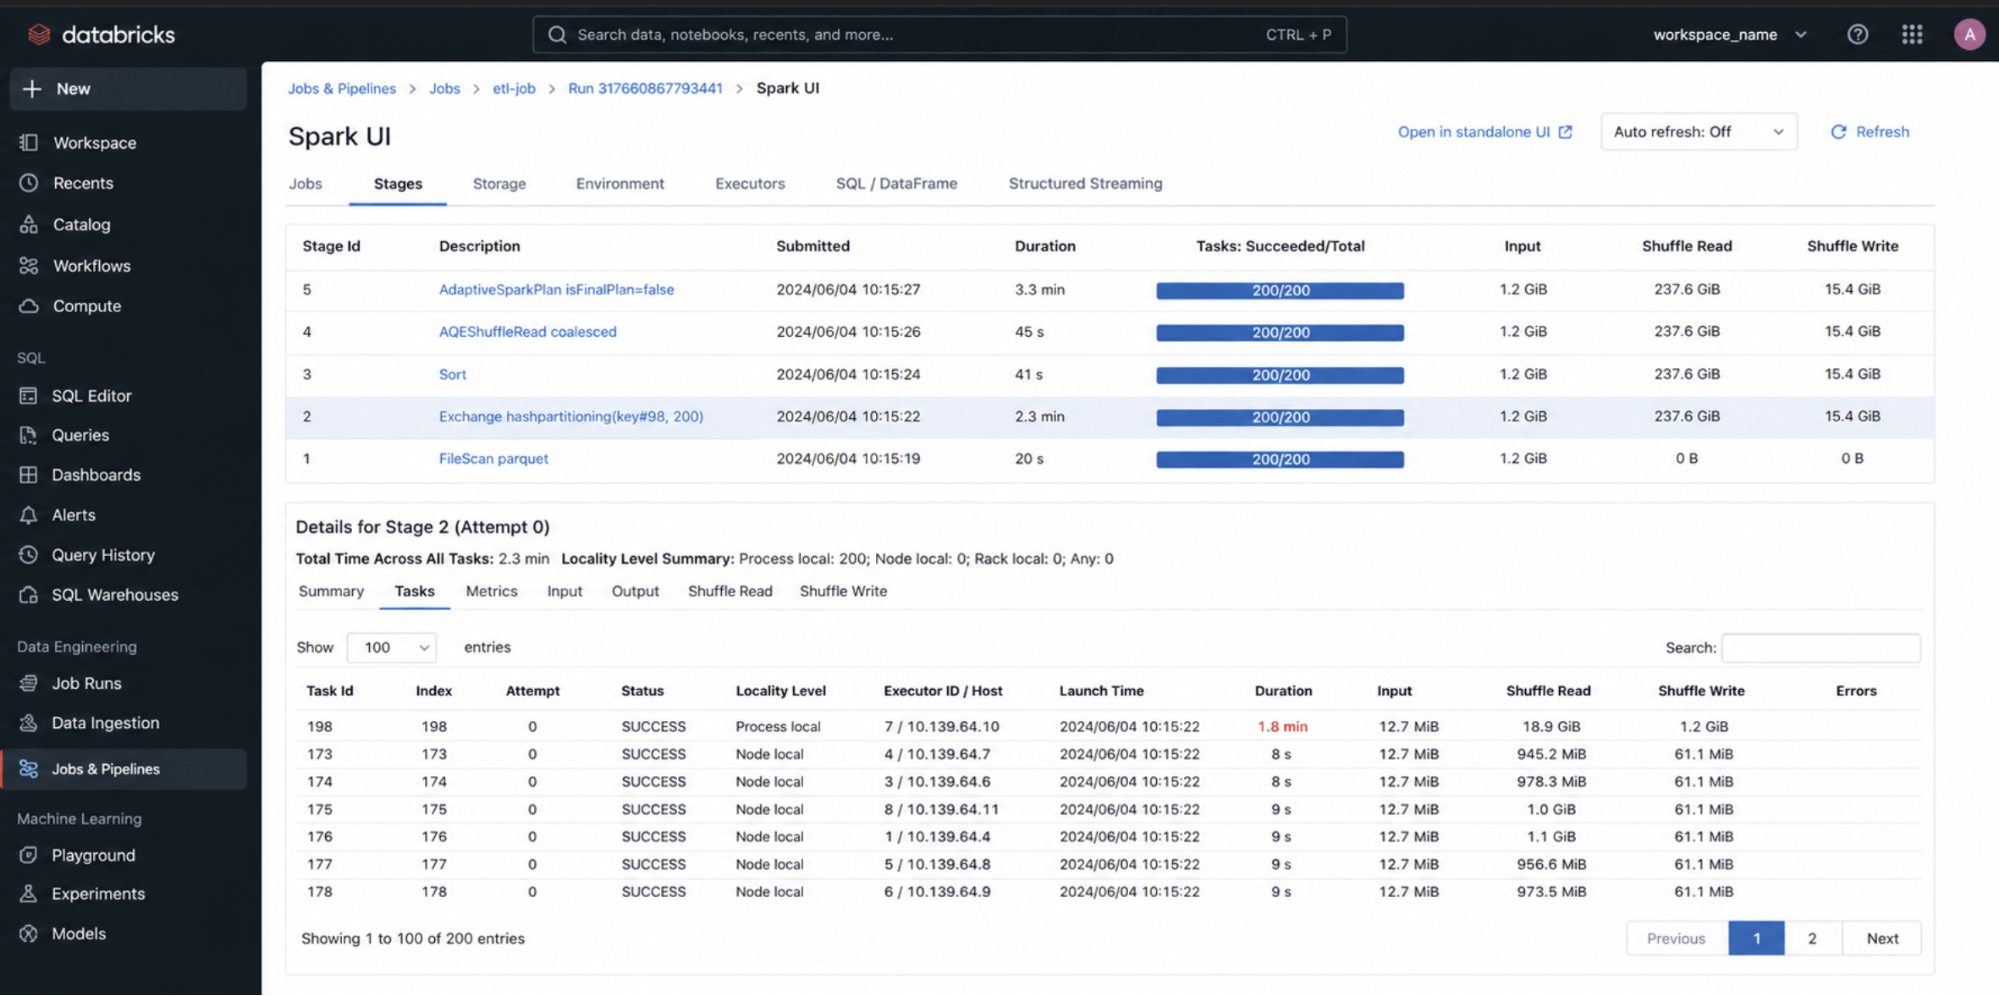
What we see in the logs and how to interpret it
Task execution time
- Uniform times → balanced partitions
- One task much slower → skew
Input size
- Large input → heavy partition
- Uneven input → skew
Output size
- Large output → data expansion
- Small output → filtering or aggregation
Spill (memory → disk)
- Spill present → memory insufficient
- Heavy spill → tuning needed (memory, partitions)
Locality level
- Data-local → efficient execution
- Remote reads → network overhead
6. SQL Query History
Scope: SQL queries
Where to find (UI path): SQL Warehouses → Query History
OR
SQL Editor → Query History
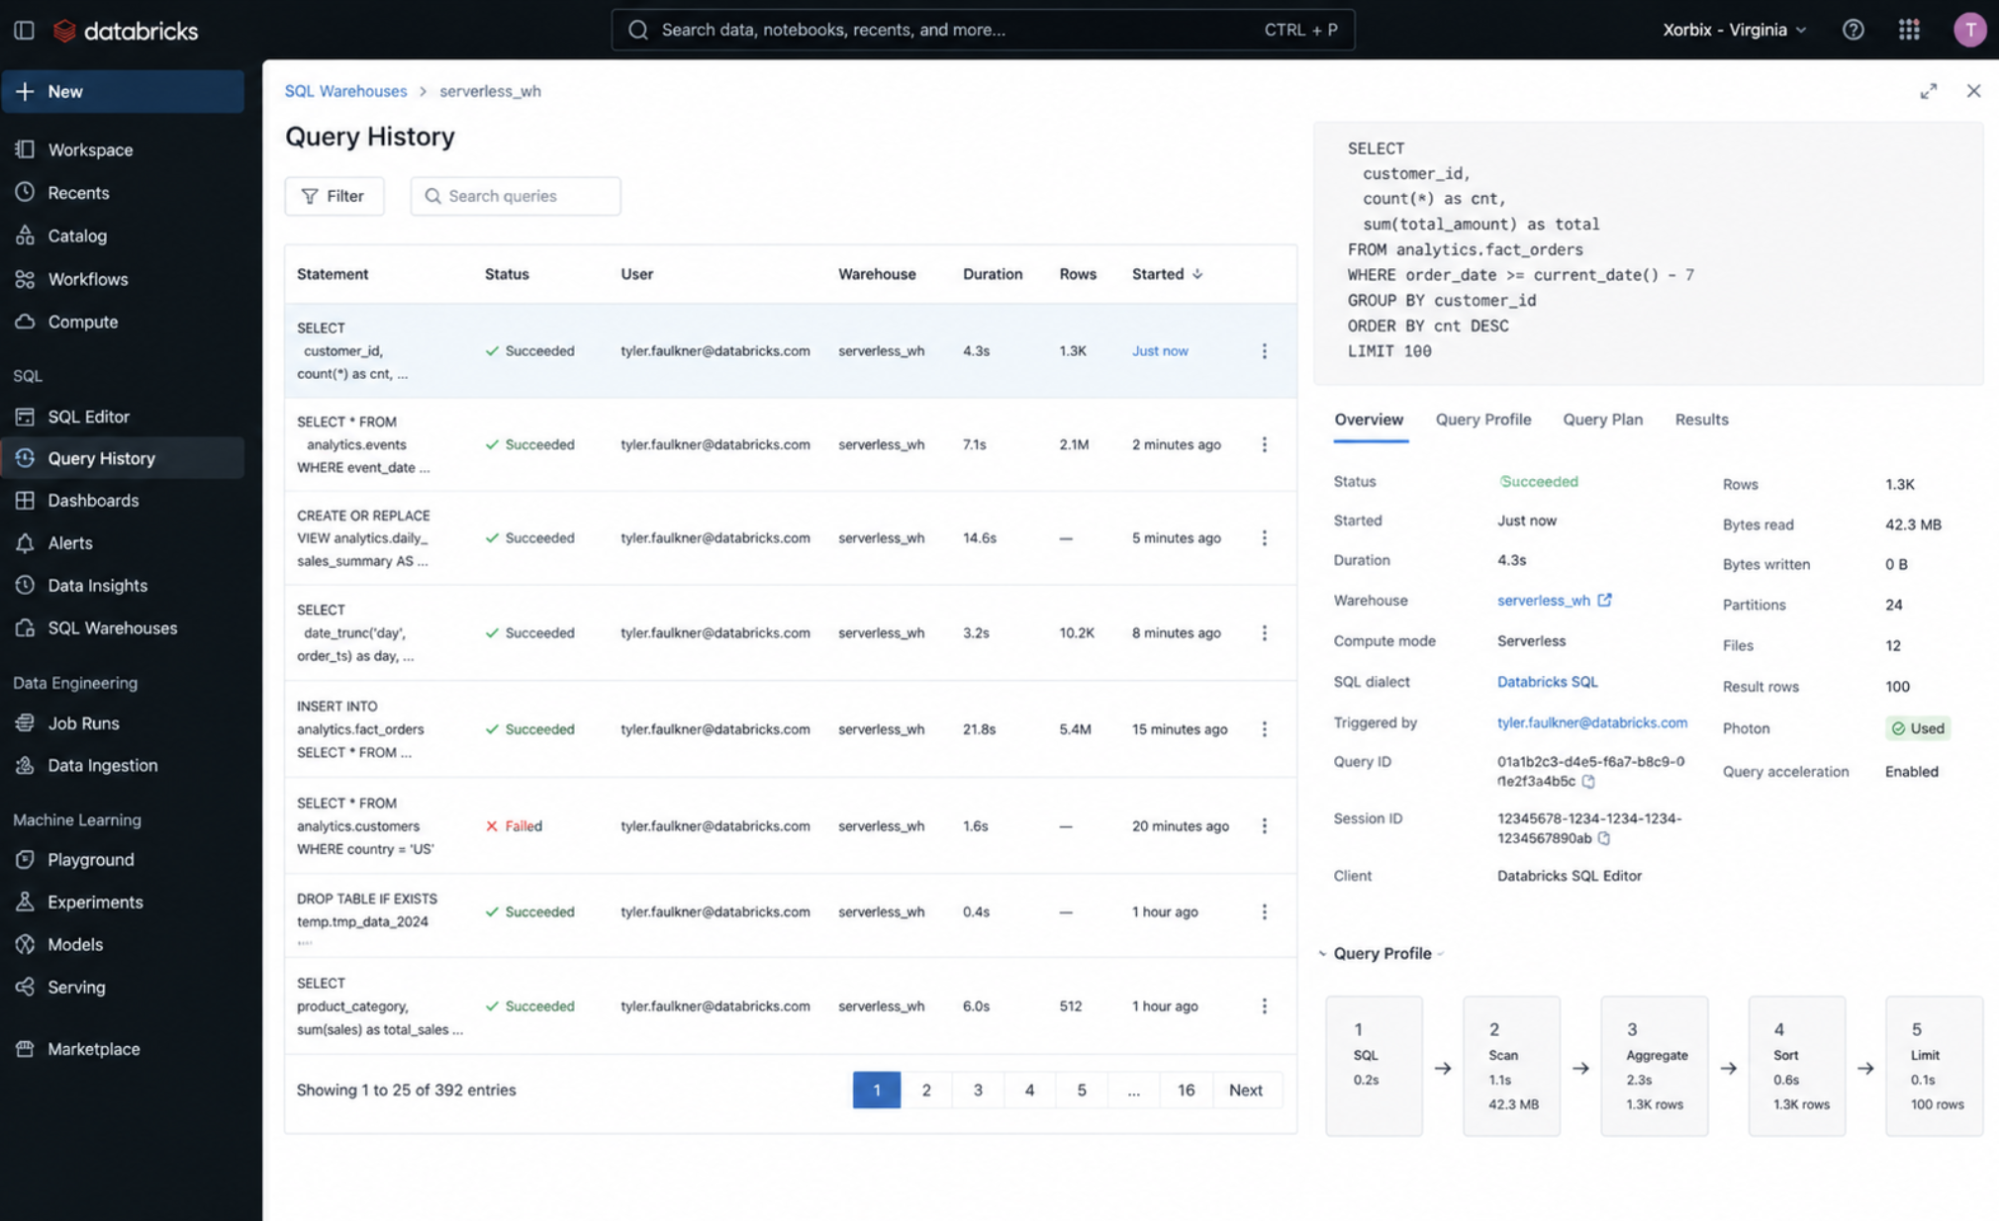
What we see in the logs and how to interpret it
Query execution time
- Long time → inefficient query
- Short time → optimized execution
Query plan
- Simple plan → efficient execution
- Complex plan → multiple joins/aggregations
Photon usage
- Photon enabled → optimized engine
- Photon not used → missed optimization opportunity
7. Delta Table History
Scope: Table-level operations
Where to find: DESCRIBE HISTORY table_name
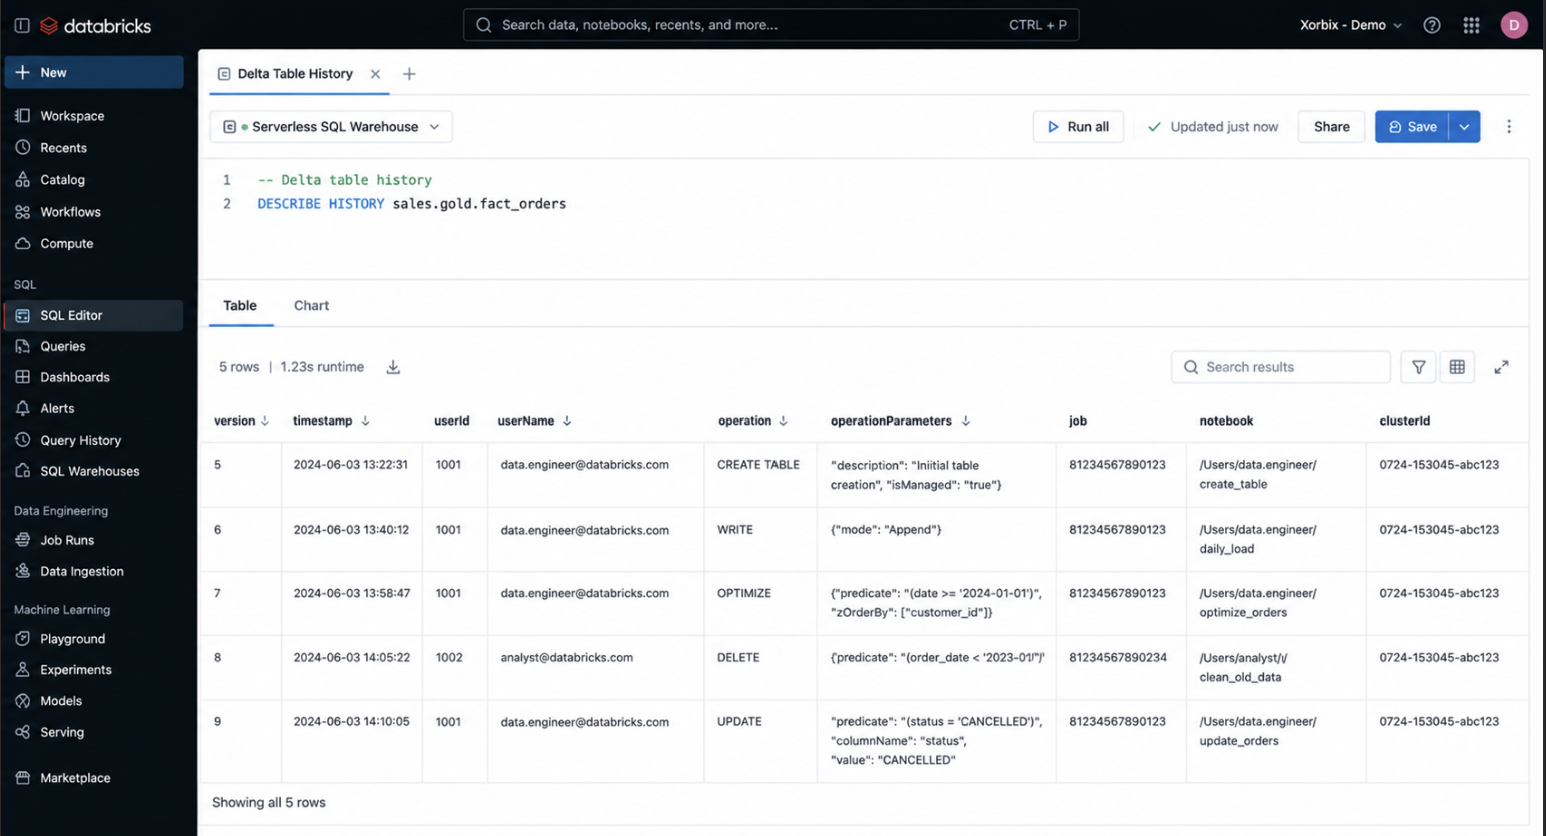
What we see in the logs and how to interpret it
Write operations
- Frequent small writes → small file problem
- Batched writes → efficient ingestion
MERGE operations
- Frequent merges → upsert-heavy workload
- Large merges → performance cost
OPTIMIZE operations
- Regular optimize → good file compaction
- Missing optimize → degraded read performance
VACUUM operations
- Performed → storage cleanup
- Not performed → storage bloat
8. Ganglia Metrics
Scope: Cluster resource usage
Where to find (UI path): Compute → Cluster → Metrics tab
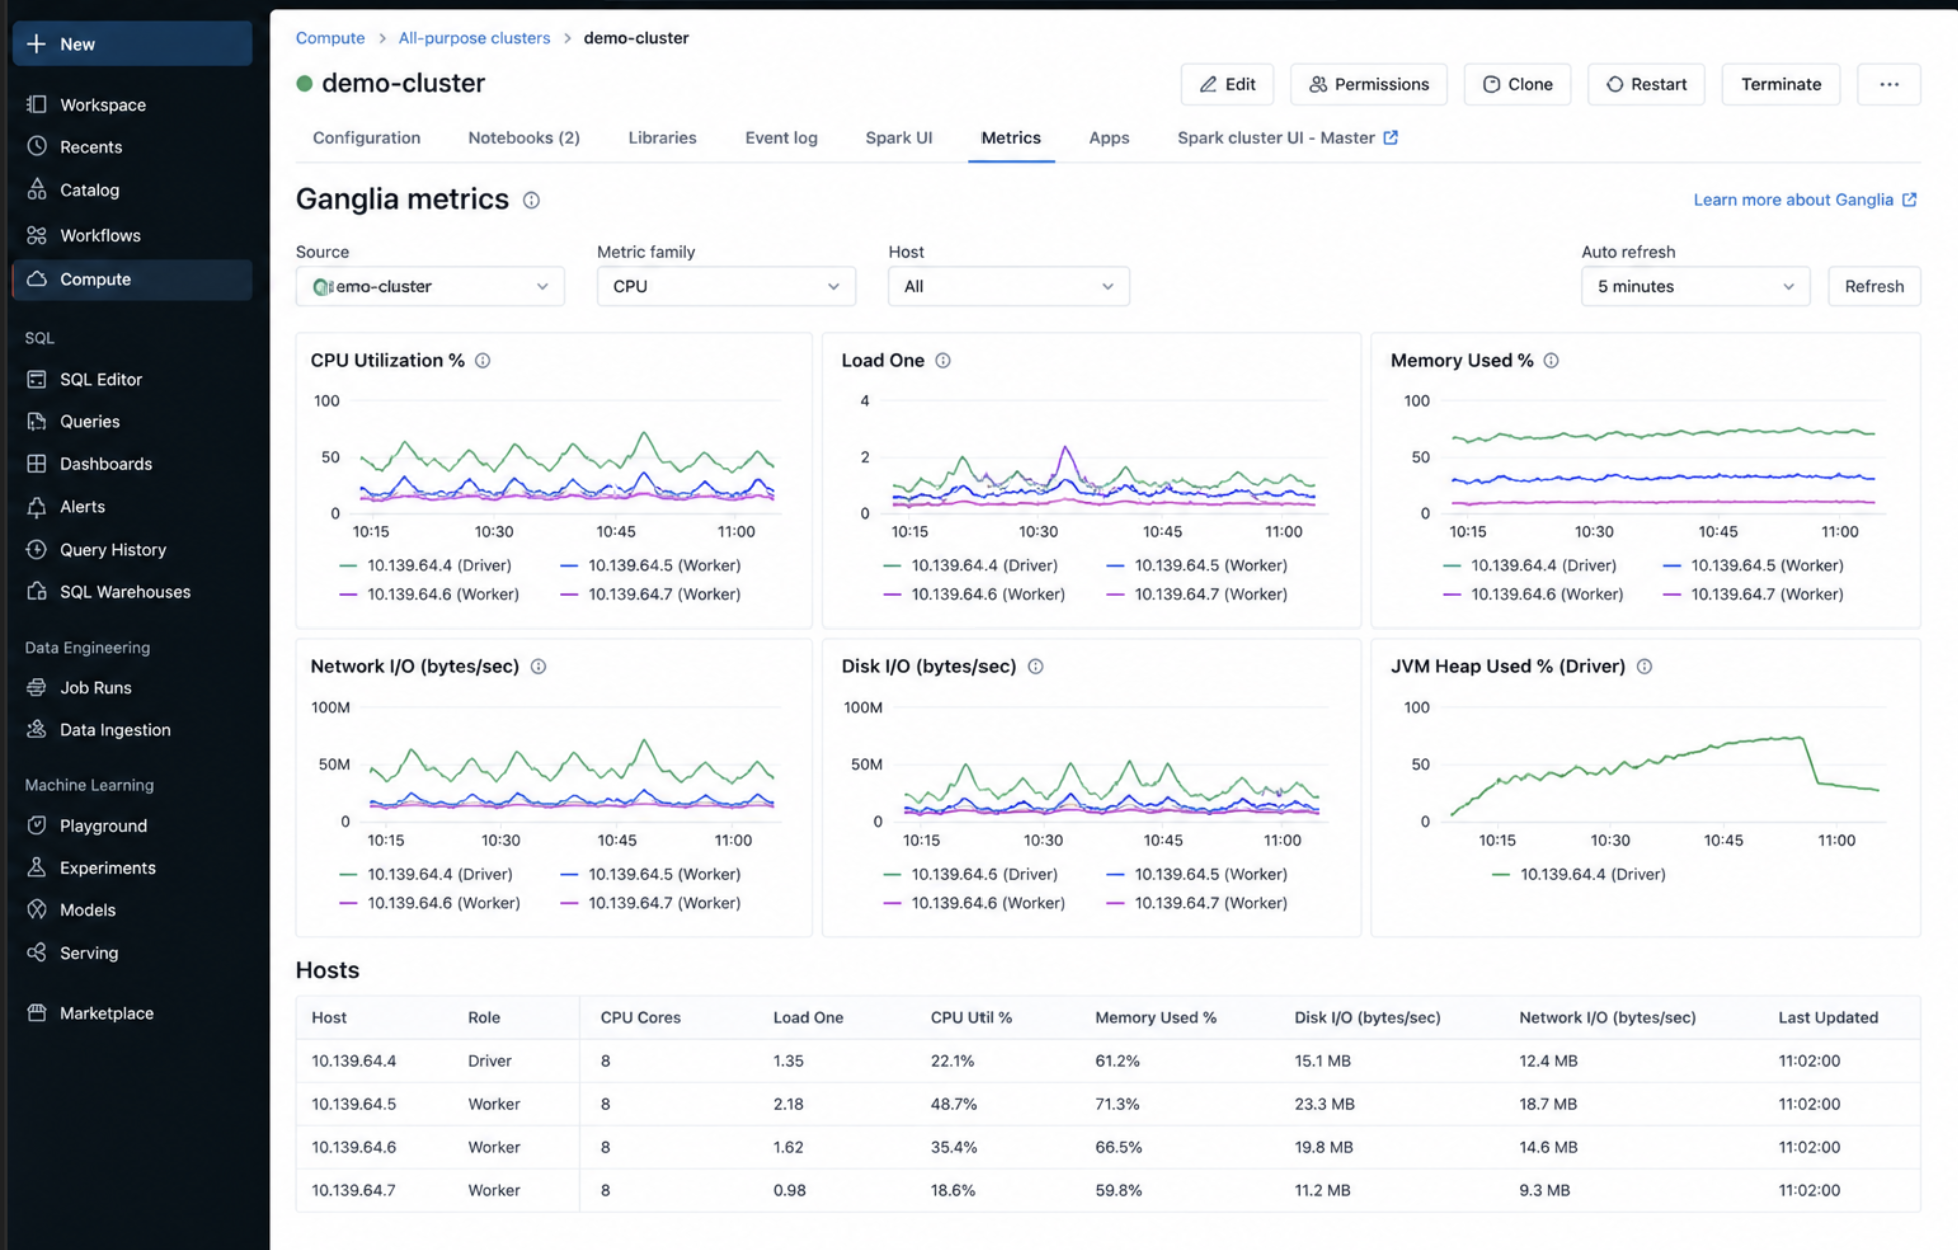
What we see in the logs and how to interpret it
CPU usage
- High CPU → compute-bound workload
- Low CPU → underutilization
Memory usage
- High memory → risk of spill/OOM
- Low memory → over-provisioned cluster
Network I/O
- High network → heavy shuffle
- Low network → minimal data movement
9. Audit Logs
Scope: Workspace-level activity
Where to find: Admin Console → Audit Logs
OR
Cloud Storage (log delivery)
What we see in the logs and how to interpret it
User actions
- Frequent access → active usage
- Unexpected access → potential security issue
Permission changes
- Changes detected → governance activity
- Unauthorized changes → security risk
10. Streaming Query Logs
Scope: Structured Streaming
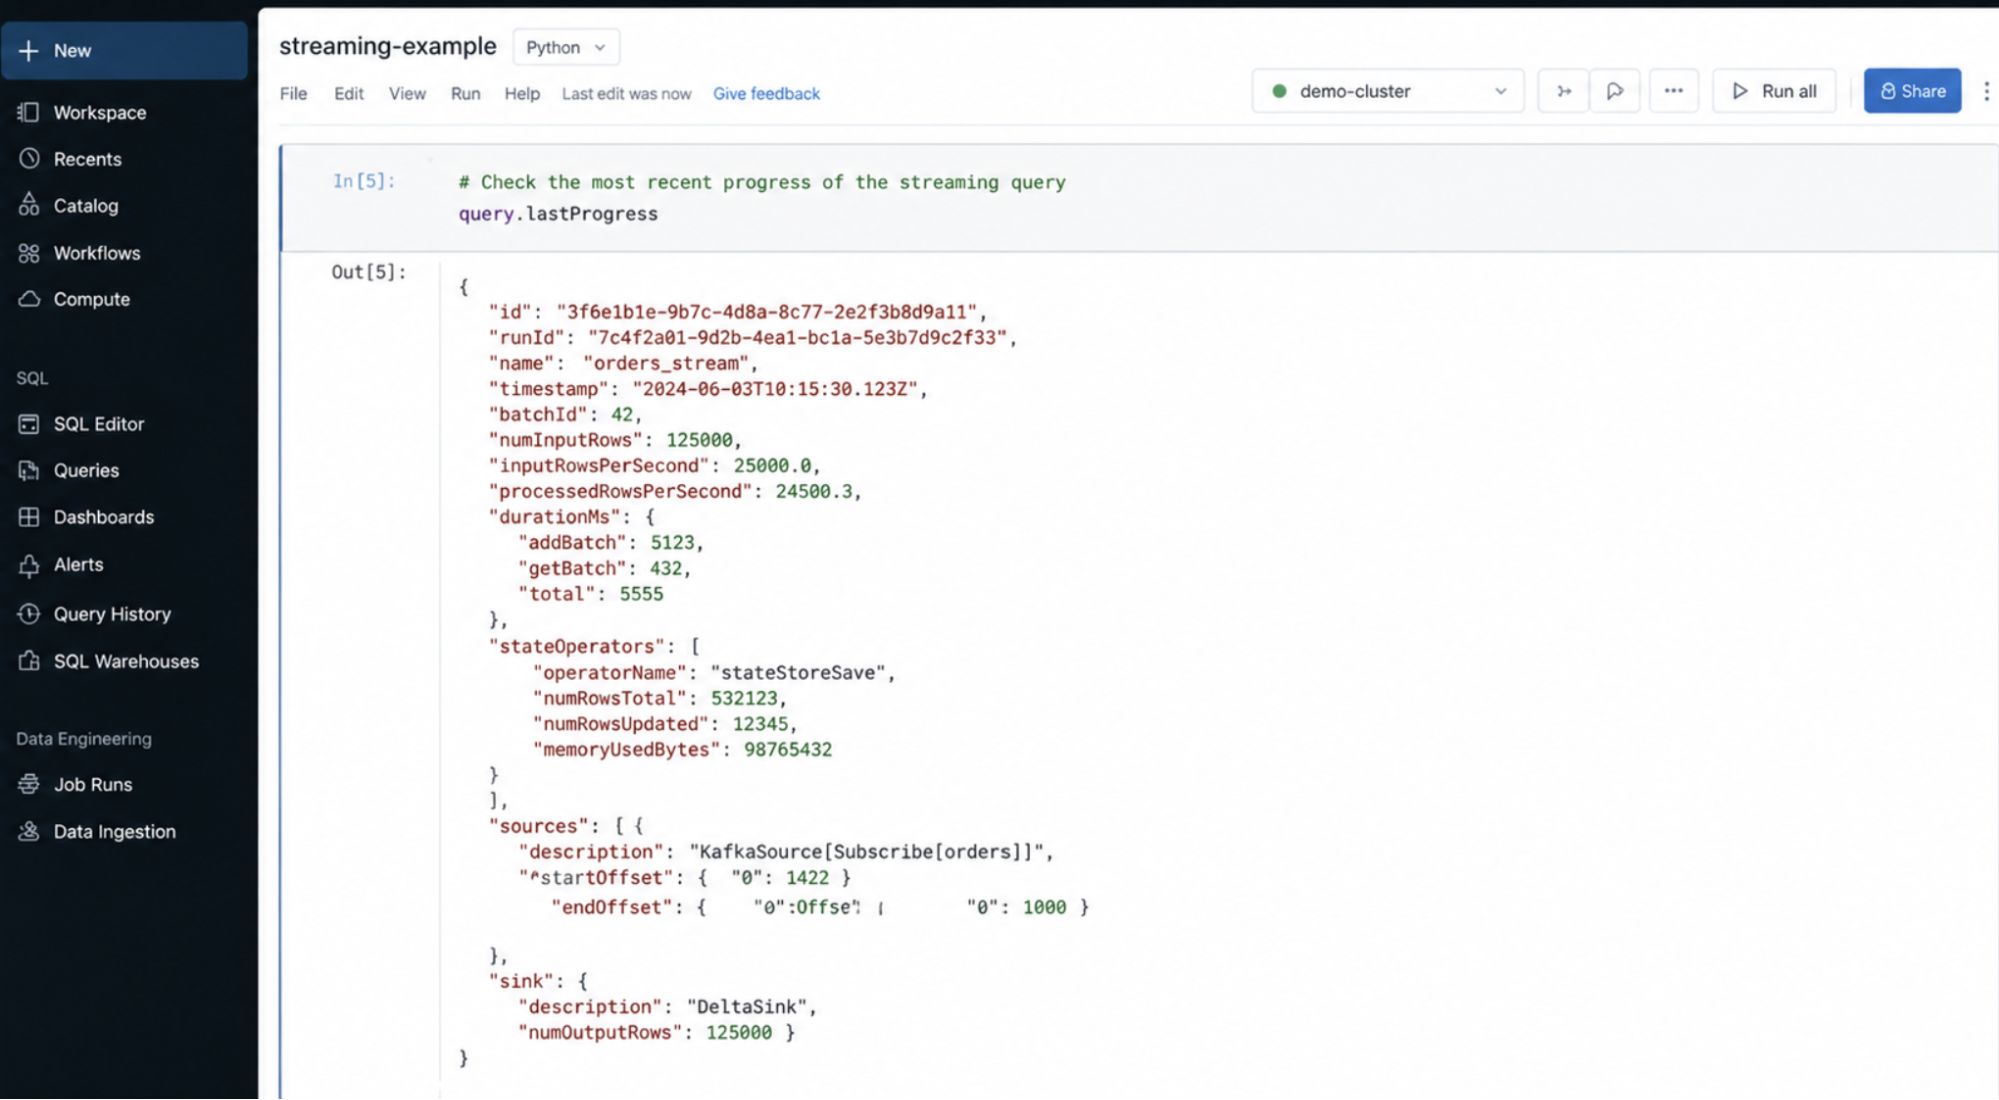
Where to find: Notebook → query.lastProgress
Spark UI → Streaming tab
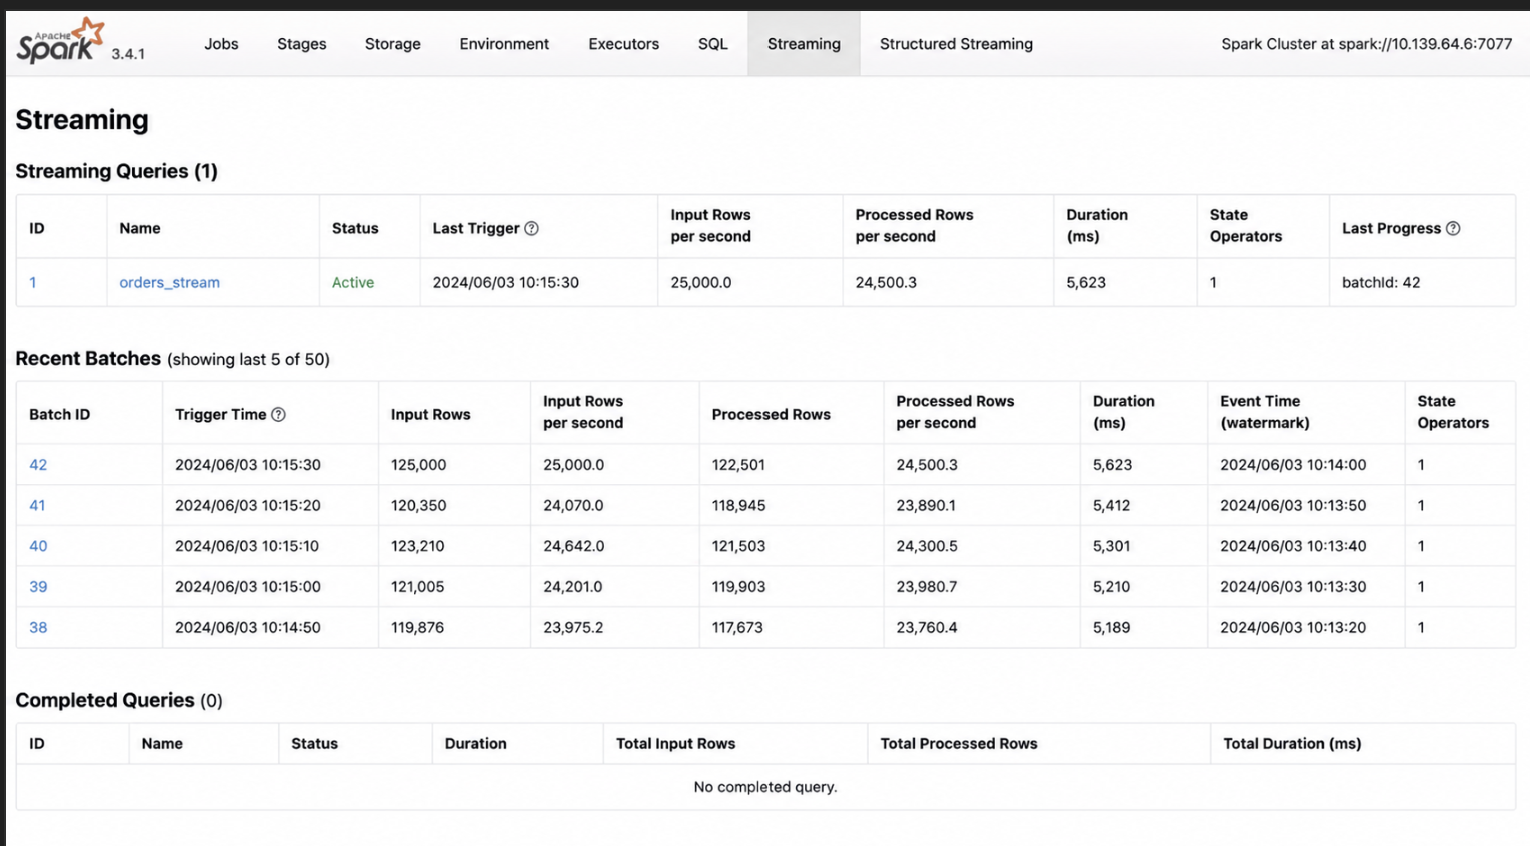
What we see in the logs and how to interpret it
Input rows per second
- High input → heavy ingestion rate
- Increasing input → growing load
Processed rows per second
- Matches input → system keeping up
- Lower than input → backlog forming
Batch duration
- Increasing duration → system under stress
- Stable duration → healthy pipeline
Latency
- High latency → delayed processing
- Low latency → near real-time
Debugging Scenarios: Putting It All Together
Real-world issues are rarely obvious. The following scenarios show how to use these logs together to diagnose common but tricky problems.
Autoscaling Not Working as Expected
Symptom
Our job is slow, and we expect Databricks to add more workers, but it doesn’t.
Think of it like this:
Autoscaling should bring in more “workers” when there’s too much work. If it doesn’t, our job stays slow because not enough machines are helping.
Where to look: Compute → Cluster → Event Log tab
What to look for and what it tells us
No “scaling up” events
We don’t see messages about adding workers.
Autoscaling is not being triggered
Possible reasons:
- Max workers limit already reached
- Not enough pending tasks (Spark doesn’t think it needs more workers)
Frequent scale up and scale down
Workers are added and removed repeatedly.
- Workload is unstable or uneven
- Often caused by poor partitioning or bursty jobs
Scaling happens too late
Workers are added, but only after the job is already slow.
- Autoscaling is reacting, but too slowly
What we check next (practical steps)
1. Check cluster limits (very first step)
Go to: Compute → Cluster → Configuration
Look at:
- Min workers
- Max workers
If max workers is already reached, autoscaling cannot scale further.
If min workers is too low, scaling may start too late.
2. Check if there are enough tasks to trigger scaling
Go to: Spark UI → Stages → Tasks
If we see only a few tasks running:
- Spark does not need more executors
Fix: increase partitions (for example, repartition)
3. Check task parallelism vs cluster size
If we have:
- 10 tasks
- 20 workers
Half the cluster will sit idle.
Autoscaling will not scale up because it is not needed.
4. Check workload pattern (spiky vs steady)
If tasks appear in bursts:
- Autoscaling may scale up and immediately scale down
Fix:
- Improve partitioning
- Avoid uneven workloads
5. Check stage behavior (hidden bottleneck)
Go to: Spark UI → Stages
If one stage is slow but not parallel:
- Autoscaling cannot help
What this tells us
Autoscaling depends on how much parallel work Spark can see.
If our job doesn’t expose enough parallelism, or if limits are too tight, scaling won’t behave the way we expect.
Final Takeaway
Each log answers a different question, but only if we interpret it correctly.
- Cluster tells us if infrastructure is healthy
- Driver tells us why the job failed
- Executors tell us how work is executed
- Stages and Tasks tell us where performance breaks
- Delta tells us what happened to our data
Debug top-down. Optimize bottom-up.